


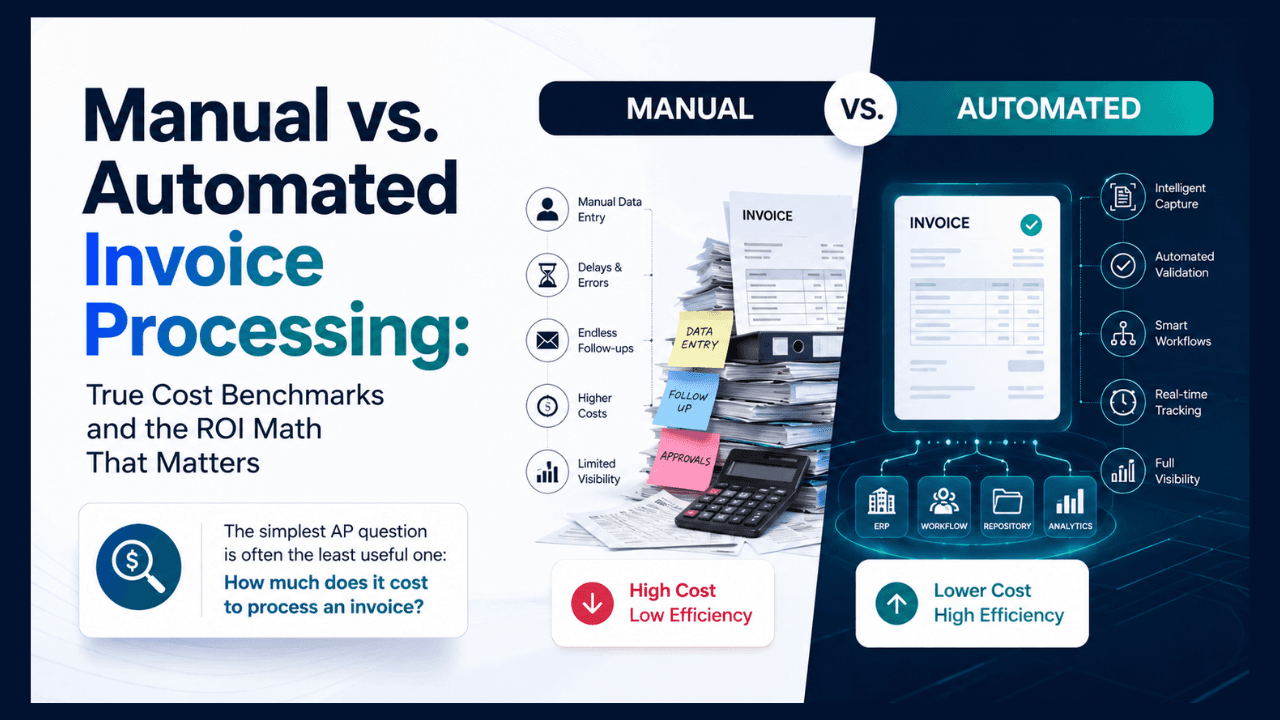
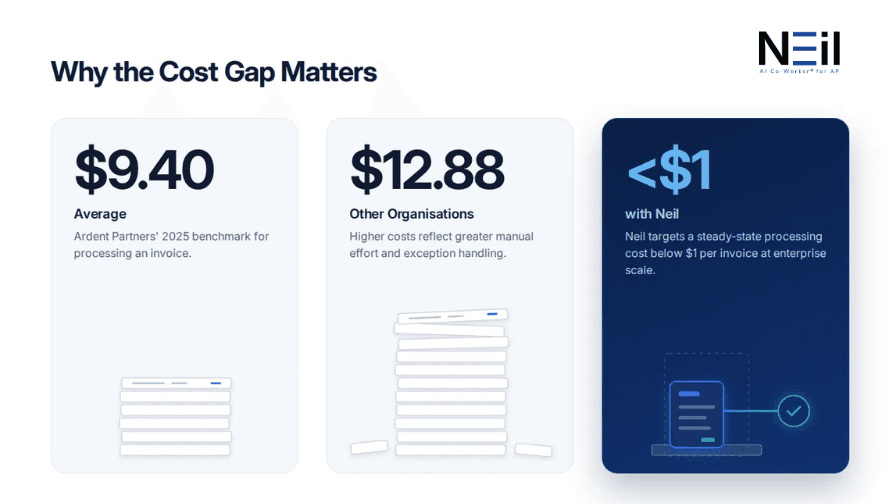
Fully loaded invoice processing costs range from $2.78 (Best-in-Class) to $12.88 (manual), with an industry average of $9.40 (Ardent Partners) and a median of $6.00 (APQC). Most of this expense hides in exception handling rather than data entry. Modern AI-native platforms like Neil eliminate manual touches at scale, targeting steady-state costs below $1.00 per invoice with 95%+ straight-through processing rates.
The simplest AP question is often the least useful one: How much does it cost to process an invoice?
What Is Included in the True Cost of Invoice Processing?
Manual processing tends to make AP look deceptively cheap because much of the real cost sits outside the invoice-entry step. A team may spend a few minutes entering fields, but the invoice can then spend hours or days waiting for a match, an approval, a clarification or a response to a supplier.
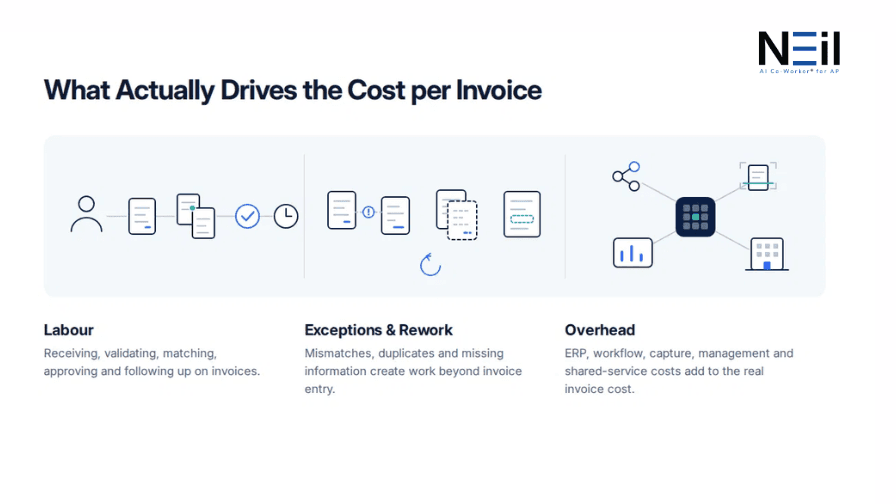
A useful cost model should therefore include:
- Direct labour: salaries, benefits and the time AP staff spend receiving, entering, checking and approving invoices.
- Technology and infrastructure: ERP, scanning, document management, workflow, storage and related systems.
- Exception and rework costs: correcting extraction errors, resolving mismatches, handling duplicate invoices and chasing missing information.
- Management and overhead: supervision, facilities, training, reporting, internal shared-service allocations and outsourced support.
- Supplier & Approval Friction: Time lost chasing approvers or fielding vendor payment inquiries
APQC explicitly includes these categories in its total AP process cost methodology, which is why its benchmark is more useful for business-case modelling than a calculation based only on AP salaries.
The same logic applies to payment operations more broadly. Deloitte found that a typical AP organization spends nearly $8 per supplier payment, with 62% of that cost coming from labour. That is a useful reminder that labour is not just a headcount issue. It is also a process-design issue. When people are spending their time moving information between systems, checking fields or chasing approvals, the organization is paying for work that technology can increasingly absorb.
This is also why the manual vs automated AP distinction needs to go beyond invoice entry. Two teams may both use an OCR engine and call their process “automated”, while one still relies heavily on people to resolve mismatches, route approvals and answer supplier questions.
What Do AP Benchmarks Tell Finance Leaders About Cost and Performance?
The benchmark gap becomes more interesting when cost is considered alongside operational performance.
Ardent’s 2025 Best-in-Class cohort does not simply spend less. It also processes invoices faster and requires fewer manual interventions.
| Metric | Industry Average | Industry Average Best-in-Class (Automated) | Lagging (Manual) | Source |
|---|---|---|---|---|
| Cost per Invoice | $9.40 | $2.78 | $12.88 | Ardent Partners (2025) |
| Median Loaded Cost | - | $6.00 | - | APQC (n=4,821) |
| Invoice Cycle Time | 14.6 Days | 3.1 Days | 17.4 Days | Ardent Partners (2025) |
| Touchless / STP Rate | 10% – 15% | 60% – 70% | < 5% | Industry Standard |
That matters because AP cost is not an isolated finance metric. A slow invoice process can affect working capital, supplier relationships and the ability to capture discounts. Gartner’s 2026 research on AP software specifically notes that static routing can increase headcount requirements, payment delays and financial control failures, and points to dynamic approval workflows as one way to address those issues.
IOFM’s latest AP benchmarking work likewise tracks cost per invoice, invoice cycle time and days payable outstanding, particularly in shared-service environments. That is useful for GCCs and other centralised finance teams where volume, staffing models and process structures can look very different from those of a smaller finance department.
For benchmarking purposes, finance leaders should therefore track at least:
- Fully loaded cost per invoice
- Invoice cycle time from receipt to ready-to-pay
- Straight-through or touchless processing rate
- Exception rate and average cost of resolving an exception
What’s the Formula to Calculate AP Automation ROI?
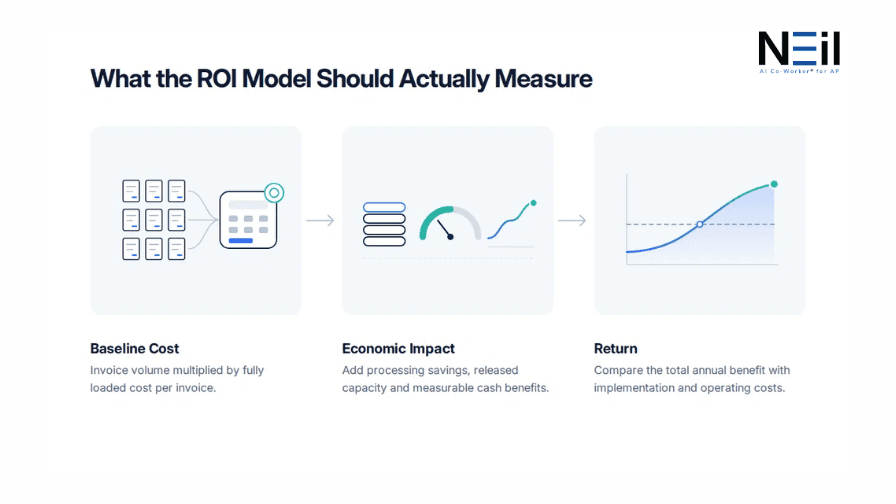
The business case for AP transformation should not begin with a vendor’s promised percentage reduction. It should begin with the company’s actual economics. That is where the AP automation ROI formula becomes useful.
A practical first-pass model is:
Then:
From there, add the benefits that can be measured separately:
Finally:
The AP automation ROI formula is simple. The assumptions behind it are not. This is where many ROI models go wrong. They count the same benefit twice. If automation allows a team to process twice as many invoices without adding headcount, that is capacity value. It should not automatically be booked as a headcount saving unless the organization actually reduces, redeploys or avoids that cost.
Enterprise ROI Scenario: 500,000 Invoices per Year
Consider a simple example. An organization processing 500,000 invoices a year at the Ardent average of $9.40 spends approximately $4.7 million on invoice processing. If it reaches $2.78, the Best-in-Class benchmark; the comparable processing cost falls to $1.39 million, creating an illustrative annual difference of $3.31 million before implementation costs and additional benefits are considered. The calculation is deliberately simple. Its purpose is to show why small changes in per-invoice economics become material at enterprise volume.
For a serious business case, I would model three scenarios rather than one:
- Conservative: modest touchless improvement and limited headcount capacity release.
- Expected: higher straight-through processing, fewer exceptions and measurable reduction in manual effort.
- Target: sustained high automation with materially lower processing cost and additional benefits from working-capital improvements.
That makes the AP automation ROI formula much harder to dismiss because it does not depend on one heroic assumption. It gives finance a range, shows which assumptions drive the result, and makes it easier to test whether the business case still works when adoption is slower or savings take longer to arrive.
How Does Neil, the AI Co-Worker®, Change the Cost Curve?
The next question is whether the benchmark itself is becoming outdated.
The Best-in-Class benchmark of $2.78 is useful, but it describes where leading AP organisations were performing in the research cohort. It does not establish a technical floor for what an AI-native AP operating model can cost. That is where a manual vs automated AP comparison can start to miss the bigger shift: an AI-native operating model is not simply a faster version of the old process.
| Capability | Legacy OCR / Workflow | Neil (AI Co-Worker®) |
|---|---|---|
| Data Capture | Field-level text capture (template dependent) | Contextual document understanding |
| Validation & Matching | Static rules (breaks on non-standard formats) | Autonomous, exception-aware matching |
| Exception Handling | Flagged to human queue | Autonomous reasoning & resolution |
| ERP Posting | Manual or semi-automated handoff | Direct closed-loop posting |
Neil, the AI Co-Worker® for Accounts Payable uses an agentic architecture across the invoice lifecycle. Its current product positioning reports 95%+ Straight Through Processing (STP) and a steady-state processing cost below $1 per invoice. That is a product-level benchmark, not an industry-wide standard, but it changes the economics materially at enterprise volumes.
At 500,000 invoices a year, moving from a $9.40 benchmark to a sub-$1 target would represent more than $4.2 million of theoretical annual processing-cost difference before implementation costs and other economic factors are considered.
The AP automation ROI formula becomes particularly useful here because the question is no longer just how much software costs. It is what happens to the full operating model when fewer invoices require manual intervention; fewer exceptions sit in queues, and the AP team spends less time coordinating routine work.
The bigger shift is what sits behind that number. Lower invoice cost does not come from making people type faster. It comes from removing the need for people to perform large portions of the work in the first place, while reserving human attention for cases where judgement adds value.
That is the number worth benchmarking.
You can visit Neil, here
FAQs
According to Ardent Partners’ 2025 research, the industry average cost to process an invoice is $9.40. Manual processing averages $12.88, while Best-in-Class automated organizations process invoices for $2.78. APQC reports a median fully loaded cost of $6.00.
What is the average cost per invoice benchmark for accounts payable?
According to Ardent Partners’ 2025 research, the industry average cost to process an invoice is $9.40. Manual processing averages $12.88, while Best-in-Class automated organizations process invoices for $2.78. APQC reports a median fully loaded cost of $6.00.
How do you evaluate a manual vs automated AP process?
Evaluating manual vs automated AP requires measuring fully loaded costs—including direct labour, ERP software, exception handling, overhead, and supplier payment operations—rather than just data entry time.
What is a good straight through processing rate in AP automation?
Traditional AP workflows achieve a straight through processing rate of 10%–15%, while Best-in-Class legacy automation reaches 60%–70%. Modern AI-native systems like Neil target 95%+ STP.
What is the standard AP automation ROI formula?
The basic ROI formula is:
ROI = (Total annual benefit − Annual operating cost − Implementation cost) ÷ Total investment
Total savings include direct processing cost reductions, capacity value, avoided fraud/error losses, and captured early-payment discounts.